
This laboratory session will demonstrate the dynamics of bacterial growth under normal and altered conditions and give you an appreciation of the very rapid growth rates of which bacteria are capable.
When exposed to only minimal nutrients, many bacteria will divide about every 1 to 3 hours. This period of time is known as the doubling tor generation time. At maximal growth rate, division can occur as rapidly as every 10-20 minutes. If nutrients were continually supplied for 24 hours, and waste products removed, one bacterium could become 4000 TRILLION bacteria, and weigh over 100 tons. This does not occur in nature because even a nutrient-rich medium would become exhausted long before such numbers could be reached.
BACTERIAL GROWTH CURVE. A typical bacterial growth curve depicts the changes in the number of viable bacteria that occur when a resting bacterium is exposed to fresh growth medium. This growth curve can be divided into 4 operationally distinct phases:
All of these phases are also represented in a bacterial colony. The outermost bacteria in the colony are not limited in nutrients, or are switching to new nutrients so they are in Lag or Log phase. Bacteria in a bit from the edge of the colony have very limited access to nutrients and are in Stationary phase. The bacteria in the central mass of the bacterial colony may be in accelerated Death phase and in old cultures may all be dead. Remember this when you streak plates and make Gram stains; sample from the colony edges.
MEASUREMENT OF BACTERIAL GROWTH: One way to measure bacteria is as viable units capable of forming individual colonies on solid bacteriological media. One speaks therefore of colony counts, each colony being a clone of a single bacterium that was present in the bacterial suspension when the sample was plated.
Direct colony counts can be tedious, and require 24 hours or more to let the colonies reach a countable size. An alternate method that we will use in class, is based on the fact that bacteria, like any other particle of matter, scatter and absorb light in proportion to their mass. If we shine a beam of light on a bacterial suspension and measure the light that comes through the other side, we get a measure of the bacterial mass. If we perform this measurement periodically as the culture grows we can use the different light readings to gauge the growth of the bacteria.
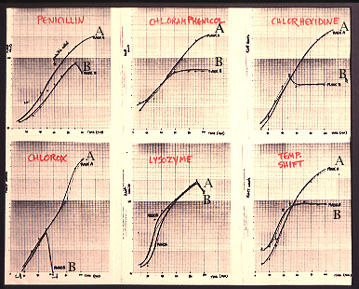
Whole, dead bacteria will absorb/scatter light in the same way as live bacteria, so to know the proportion of live bacteria, one still has to plate out samples. During the Death phase of the growth curve, or following the addition of some antimicrobial agents, lysis of the bacteria will reduce the amount of light scatter/absorption. For today's lab, the broth culture has been placed in a special side-arm flask and incubated in a 37°C shaker waterbath. The side-arm fits into the sample port of a Klett colorimeter, allowing measurements to be made without removing any culture and thus preserving the volume. The waterbath (as opposed to an air incubator) is used to minimize temperature variations and assure a constant and rapid growth rate. Try to minimize the amount of time your flasks are out of the waterbath. Be careful with these cultures; the flasks are delicate and EXPENSIVE.
The instructor will remind you how to take an absorbance reading on the colorimeter. You will measure the absorbance at 30, 40, 50, 60, 70, 80, 90, and 100 minutes. The colorimeter expresses absorbance as a relative scale of Klett Units, and not units of absorbance.
